Three evenings are obviously not enough to cover the whole issue of the impact of digital technology on the environment (remember that digital technology currently accounts for almost 4% of greenhouse gas emissions – GHGs – worldwide), let alone three pages.
Even so, this is an attempt to summarise everything that was said during the first edition of the Digital Impact Week, which was held from 2 to 4 November 2021, with our partners: Green IT and OVH.

Tuesday 2 November 2021: From Junkie to Frugal Designer
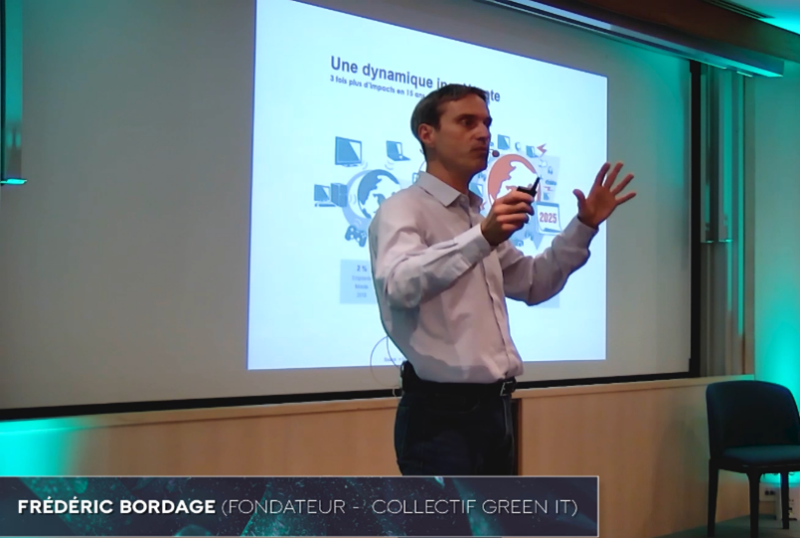
Bertrand Bailly (Davidson Consulting) and Frédéric Bordage (Founder of the GreenIT.fr collective)
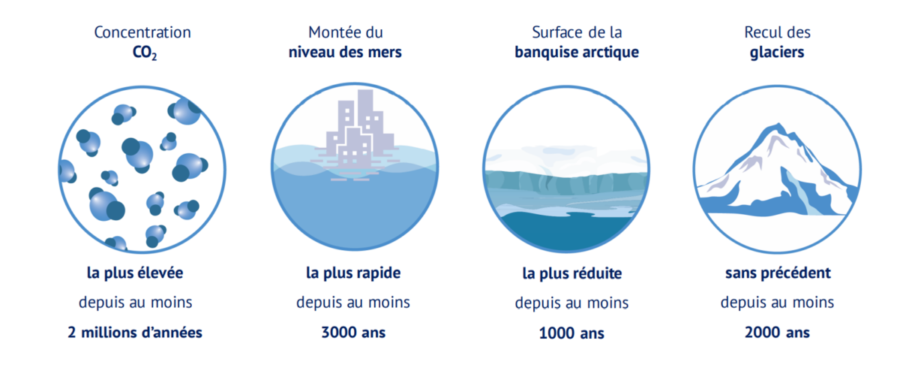
The 6th IPCC report[1] makes for chilling (or rather, hot) reading. The human influence on climate is an established fact, and the planet has warmed by between 0.95 and 1.20 °C since the beginning of the industrial era. The consequences are already visible: rising sea levels, shrinking Arctic sea ice, retreating glaciers… and one of the identified causes? The increase in the concentration of CO2 in the air, which contributes to the greenhouse effect[2].
[1] IPCC: Report published by the IPCC since 1990, which in its 6th edition reviewed 14,000 scientific publications, involving 234 authors from 65 different countries, with over 78,000 review comments.
[2] Greenhouse effect: A number of naturally occurring gases in the atmosphere (greenhouse gases: GHGs) contribute to global warming. The over-consumption and processing of raw materials by humans has led to an increase in greenhouse gas emissions.
In 2020, 3.8% of GHG emissions will be attributable to digital technology. In 2010, the environmental footprint of digital technology was 2%. In other words, it has doubled in just 10 years – and the GreenIT.fr collective predicts a similar increase in barely 5 years. Without a concerted response, digital will therefore account for 6% of the global footprint by 2025[1].
“Digital technology is a critical, non-renewable resource that is inexorably being depleted” – F. Bordage.
In addition, the manufacture of digital equipment and devices relies on “finite” resources such as rare minerals, which will be exhausted within one or two generations.
[1] Source: “Environmental footprint of the global digital economy”, GreenIT.fr, 2019 and “iNUM study: environmental impacts of the digital economy in France”, GreenIT.fr, 2020, updated figures.
The addiction we have to the digital technology we have developed is along the lines of a “junkie” mentality. This is why a change of attitude is needed: we need to “sober up”. Reducing the production of electronic devices, increasing their lifespan, rationing their use… these are all examples of improvements that can reduce our environmental footprint. This sobriety also takes the form of a frugal design approach. This eco-design is not limited to the design of an application or a website; rather, it is a business initiative in a wider sense!
As simple as this initiative may be, it can be accompanied by a multitude of “ancillary” services, such as the option of booking a hotel, a car, promoting partner brands, etc. These ancillary services are often part of the “software bloat”. Digital sobriety then aims to reduce this surplus by delivering just the necessary service.
This may sound alarming. But measures aimed at reducing the footprint of digital services are already emerging. Through eco-design, adopting and sharing best practices and tools and paying attention to a range of metrics, it is possible to drastically reduce the environmental impact of a digital project. We wished to demonstrate this through practical examples in our following talks.
Thursday 3 November: What are the drivers for a Less-impact approach?
Johann Besse (CDO, Davidson Consulting), Hannah Setton (IT Project Manager), Jules Delecour (Lead Culture Tech), Benjamin Danglot (PhD student in software engineering)
The second evening was dedicated to putting “right digital tech” recommendations and philosophies into practice in a DevOps approach.
The aim? To present a cross-cutting approach, starting with control over its impact through project management. The PMI® provides a number of drivers for building control over its ecological impact into the project management process. An example is risk management: by adding a single extra point in the categorisation of a risk’s impact criteria, it is automatically given a higher weighting, which encourages the implementation of “low-impact” actions.
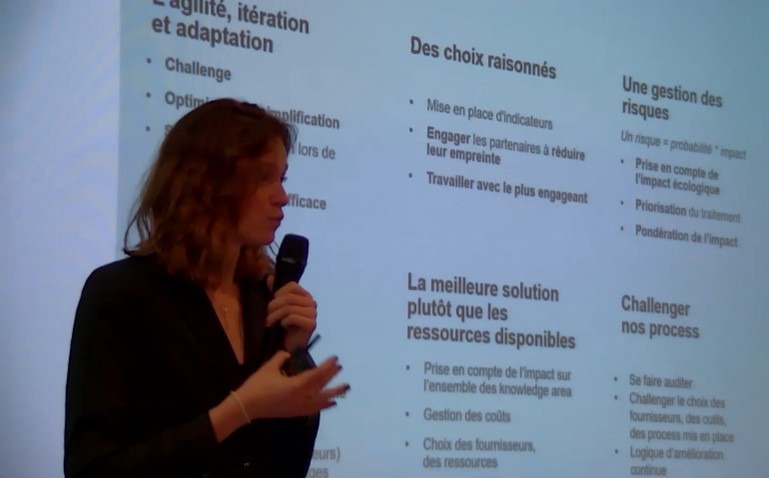
Projects are all about people, and it is therefore essential to work as early as possible on training development teams and raising their awareness; the same is true for all project stakeholders. Tools – such as the Climate Fresk[1] – exist and can be applied at different levels in an organisation: team, project, company, etc. It is important to choose your partners (suppliers, customers, etc.) according to their “low-impact” commitments: this means adding the “I=impact” criterion to the usual QCD (Quality, Cost, Delivery) criteria.
[1] Climate Fresk: Climate change awareness tool – https://climatefresk.org/
When the right choice of technologies and a return to frugality enable the development of sustainable solutions, we are dealing with “Right-Tech[1]”.
Managing a project while controlling its impact also requires monitoring during the implementation phase. The DevOps/DevSecOps culture provides a set of tools and metrics to ensure control over the project. The objective: to directly integrate a set of practices and tools into DevOps processes.
[1] Right-Tech: A concept mentioned in Gazette n°100 published by the Ecole des Mines – http://www.annales.org/gazette/2019/gazette_100_01_19.pdf
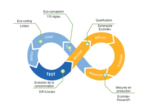
In partnership with the GreenIT.fr collective – including Orange Business Service, Snapp’ and others – Davidson is developing a Sonarqube[1] Open Source plugin intended to highlight good Eco-coding practices (https://github.com/cnumr/ecoCode). Other tools are also developed in the same way, such as GreenIT-Analysis-cli (https://github.com/cnumr/GreenIT-Analysis-cli) which “wraps” the Chrome GreenIT-analysis plugin to measure the EcoIndex of a website and suggest improvements for each page on the site. The aim of such projects is to develop a set of tools for each stage of the software delivery process.
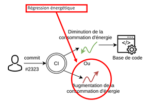
Of the various stages of software delivery, the testing phase is crucial. It is also a way of analysing its energy behaviour. Now, using the Diff-XJoules tool (https://github.com/davidson-consulting/diff-jjoules) it is possible to measure the energy regression for an application’s unit tests. When placed in a continuous integration and deployment chain, it can be used to decide whether or not to block the delivery process of an application if its energy consumption increases significantly.
[1] Sonarqube: Source code analysis tool developed by SonarSource – https://www.sonarqube.org/
The basis of the Less-impact approach is therefore to give meaning to all these metrics by monitoring indicators and ensuring compliance with a set of good practices.
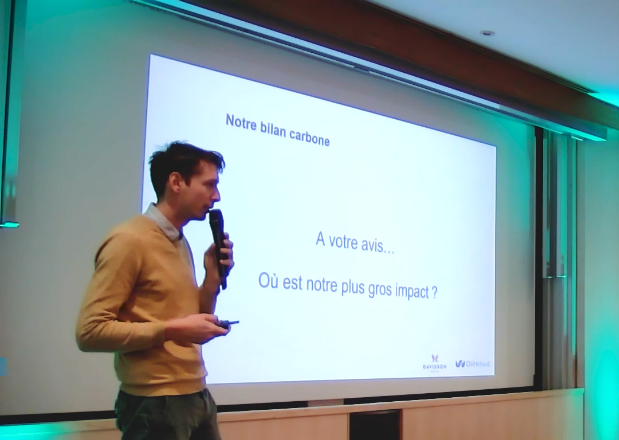
Thursday 4 November: Environmental impact of a hosted service
Tristan Vuillier (Director of OVHCloud environment programmes)
Having shared some basic drivers for adopting a Less-Impact approach, an entire evening was to be devoted to hardware management. This is why Tristan Vuillier, Director of Environmental Programs at OVHcloud[1], presented the concept of a hosted service and detailed the environmental indicators that can help reduce the environmental impact of a service hosted in the Cloud.
[1] OVHCloud is a French cloud service provider. It competes directly with the AWS, Azure and GCP public clouds.
The applications developed deliver their service through a set of hardware (motherboard, processors, power supply, etc.). The production of these materials and their transportation (scope 3) to the datacenters represent 63% of the OVHCloud Cloud Service Provider’s carbon footprint, while the datacenters’ power consumption represents 34% of the footprint (scope 2). Finally, direct emissions (scope 1), such as those from OVH’s offices or generators, represent only 1% of the footprint. What we need to remember from this breakdown is that it seems necessary for the hosting company to recycle and extend the life of the equipment used in its datacenters. Each piece of equipment that is replaced goes through an automatic rehabilitation stage to be recommissioned if its condition allows it. The hardware life cycle then follows the following steps: Reuse, Repair and Recycle.
The second focus is to reduce the Scope 2 carbon footprint by improving the datacenters’ energy consumption indices. There are 4 main environmental indicators:
- PUE: Power Usage Effectiveness: A measurement of the energy efficiency of a datacenter. The most efficient datacenters tend (from the top) towards 1.
- WUE: Water Usage Effectiveness: Measurement of water use for datacenter operations.
- CUE: Carbon Usage Effectiveness: Measures the intensity of carbon use in a datacenter.
- REF: Renewable Energy Factor: Measures the ratio of renewable energy used to total energy in a datacenter.
- Reused components ratio: The rate of reuse of reused components.
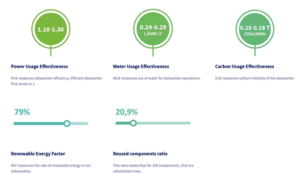
Hints for OVHCloud
These indicators help companies to make an informed choice of Cloud service provider and participate in reducing the carbon footprint of their application or information systems.
To conclude the first edition of the Digital Impact Week
Through the presentations by our speakers, we wanted to create a collective response and sources of optimism, and to contribute to the emergence of a more sustainable digital environment in the face of global warming. We presented cross-cutting approaches, along with solutions, methodologies and projects to better control ecological impacts during the design, development and implementation of software.
And as this is only the beginning, and the task at hand remains immense, we suggest that you continue to interact and share directly with us, to jointly build a fairer and more sober digital world: impact@davidson.fr