The GreenIT-Analysis extension for the Chrome browser provides a practical tool for developers to analyse, evaluate and improve a webpage’s carbon footprint. However, it is not possible to automate its usage to cover the content of a whole website.
What is the solution then? Set up an interface in “online command” mode to emulate the way the tool functions simultaneously on each of the pages and generate a full report. We explain everything!
Practical solutions to reduce the environmental impact of digital
Environmental concerns affect all sectors and IT is no exception! According to the French Agency for the Environment and Energy Management (ADEME), this sector alone is responsible for nearly 4% of global greenhouse gas emissions. This figure could still double by 2025 with the evolution of usage, meaning around the equivalent of the current proportion of global greenhouse gas emissions attributed to cars. The internet itself represents a significant proportion of this footprint with pollution caused every time a new page and its elements are downloaded.
For this reason, Davidson has chosen to act alongside committed parties, including the association GreenIT.fr, in order to implement and share innovations to limit the ecological impact of digital tech.
Example: optimisation of the GreenIT-Analysis tool to assess the environmental performance of a website.
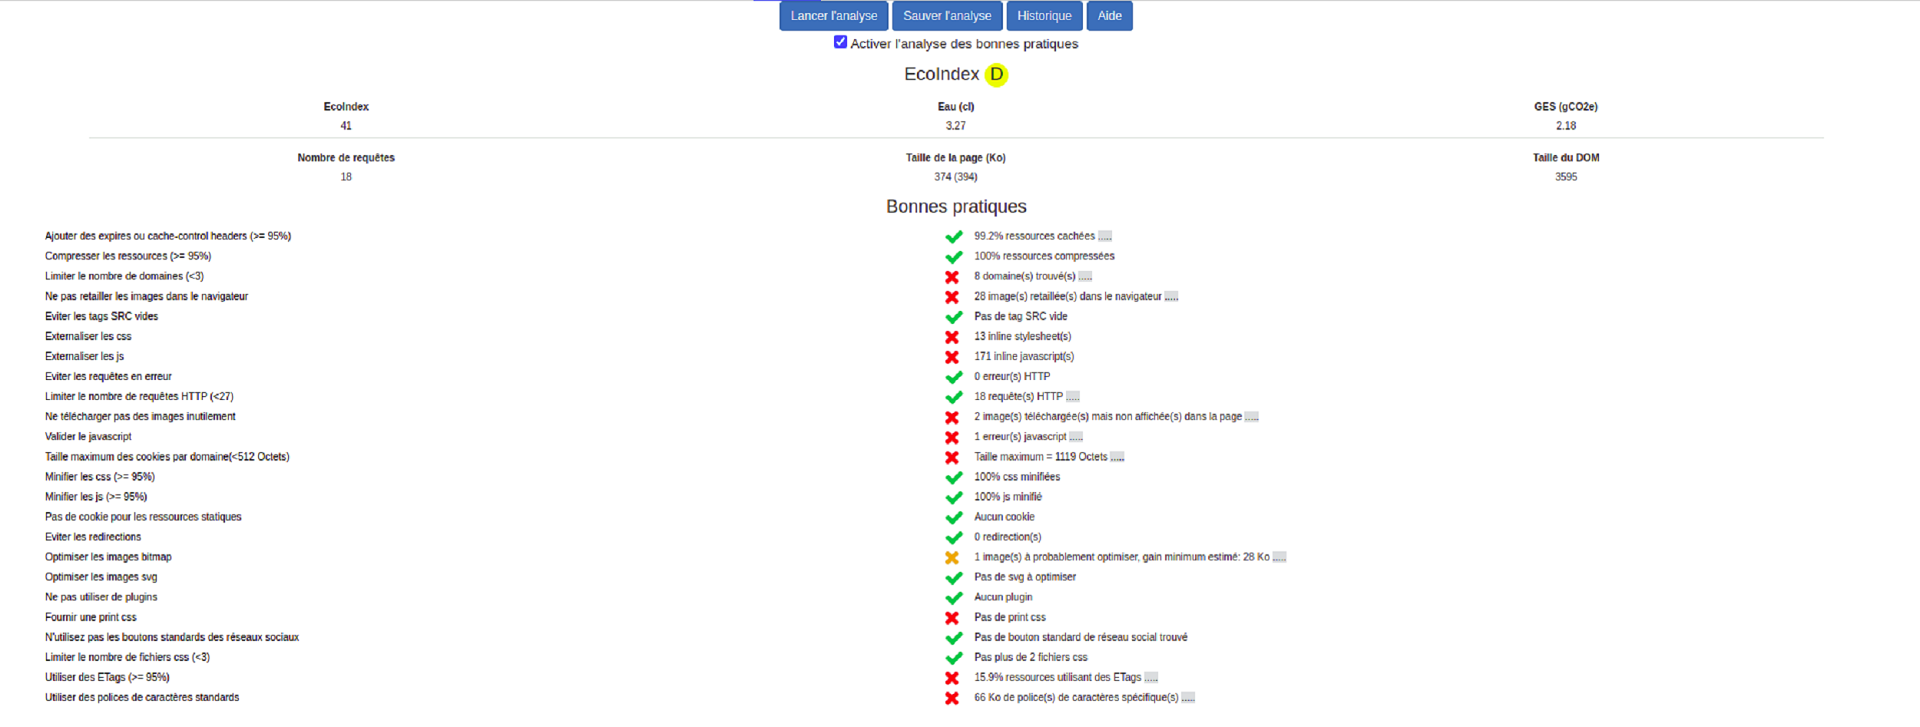
GreenIT-Analysis is an extension created for Chrome. It allows users to calculate the carbon impact of a webpage and suggests good practices that will make it more ethical. Functional and technical design, ergonomics, content… the 115 rules of eco-friendly web design are implemented by GreenIT Analysis.
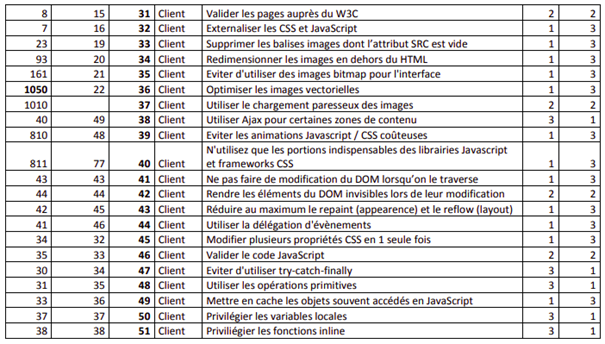
By analysing the page’s Document Object Model (DOM), as well as the number of http requests and JS validation, the tool provides a report and practical indications that help developers to optimise the design of their site to make it less energy-consuming. Furthermore, this analysis also allows internet users to judge the ecological impact of the sites they visit.
However, although useful, this method is still incomplete: its use is currently limited to studying a single page and still requires an action from the operator for each new analysis. On its own it therefore does not allow analysis of a whole website.
One interface to control them all!
In order to automate usage of the tool for a whole website, we have created a version of the extension with a command-line interface (CLI). This launches a Chromium browser in the background, controlled using Puppeteer, which opens each page to be analysed and emulates the extension’s operation.
Thanks to Chromium and Puppeteer, the simulation is automatically executed as a background task. The interface that allows the execution of this simulation then becomes a CLI.
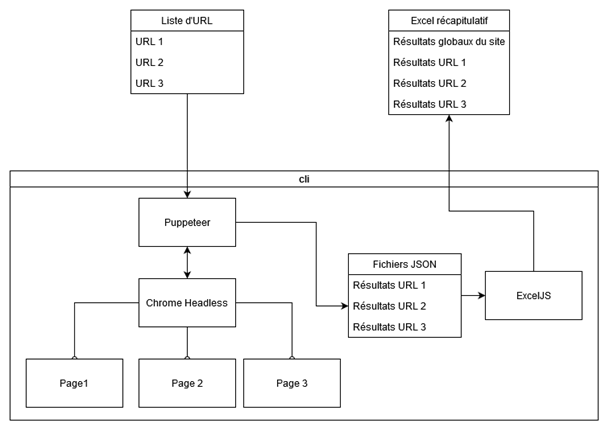
Puppeteer retrieves each result and temporarily records them in JSON files. Several analyses can even be performed “in parallel” so as to avoid idle time, such as loading of a page.
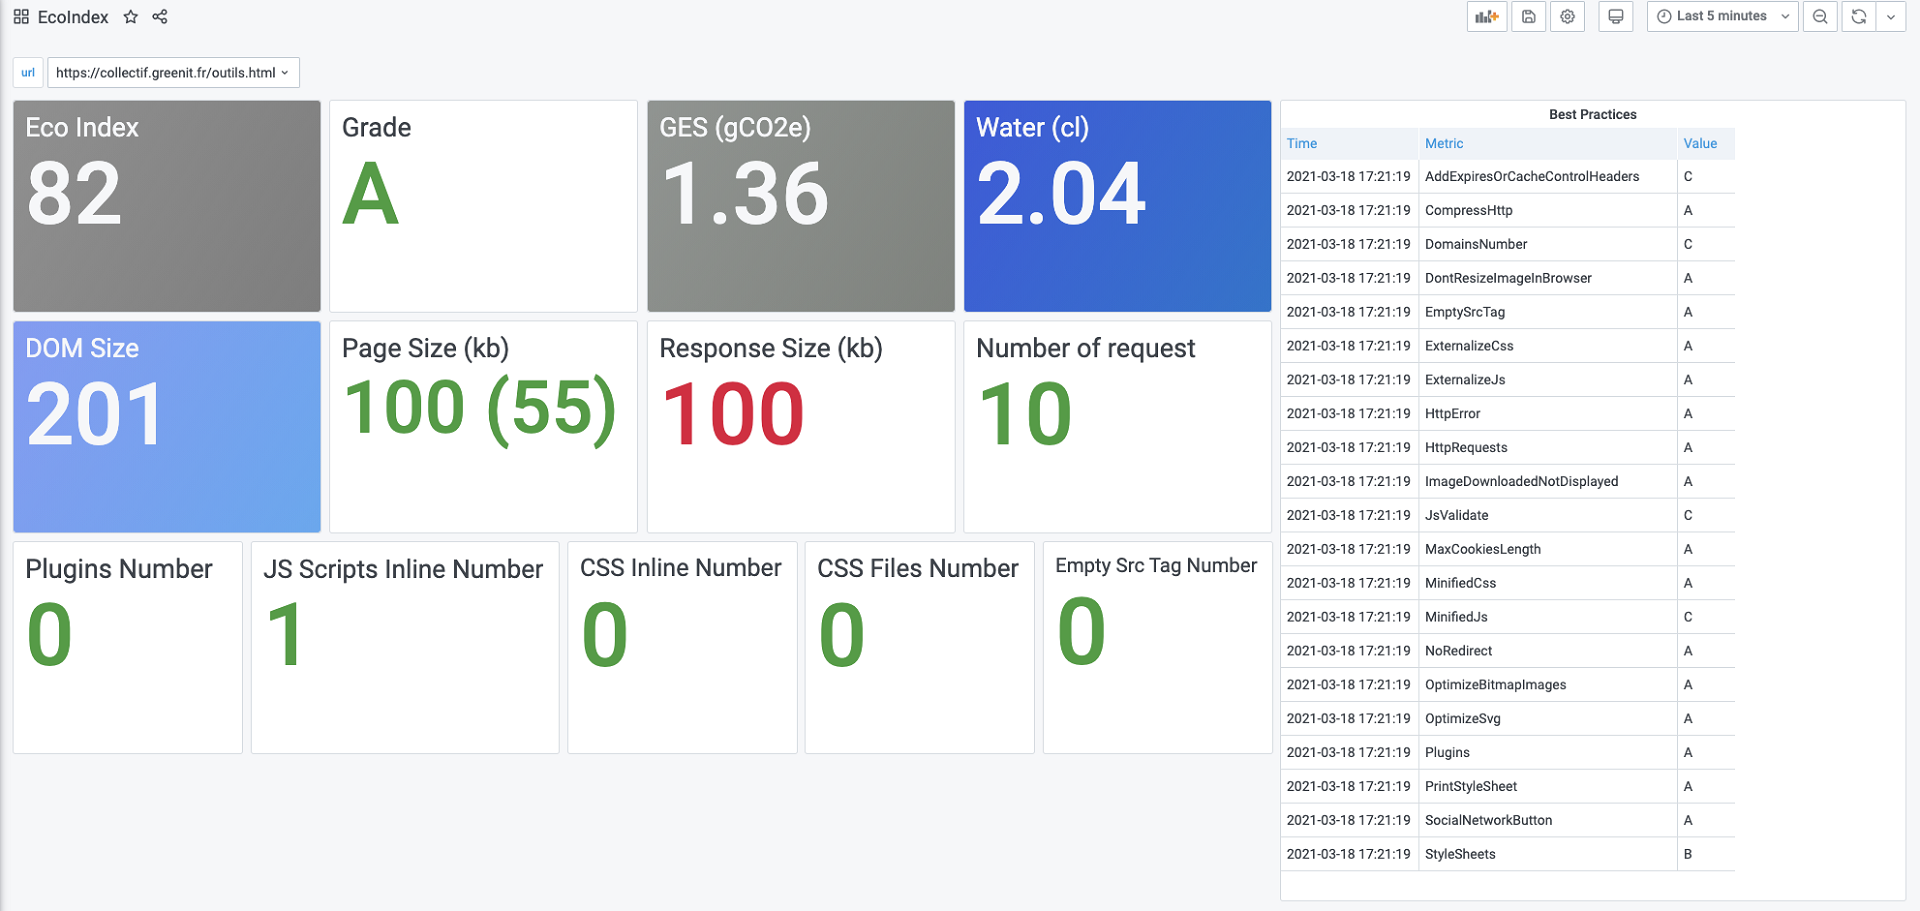
Once all the pages are analysed, a summary file is produced that groups all of these results as well as an overall report. The developer thus has an overview of the environmental impact of their whole site and any indications that may be useful to optimise it.
Green screen!
Usage evolves and these days mobile browsing is as important as the traditional computer-based approach. It becomes essential to consider optimising websites for these consumption modes. For example, an image designed solely for a computer screen will be reduced on a mobile device, thus wasting precious resources in downloading a larger image than necessary.
This will result in a lower ecological score for this platform. In order to limit these inconveniences, GreenIT-Analysis therefore emulates a viewing platform according to the medium (desktop, Galaxy S9, Galaxy S20, iPhone 8, iPhone 8 Plus, iPhone X, iPad, etc.).
DevOps: the virtuous cycle
This method makes it possible to now integrate this automatic analysis process in a general approach. By combining the CLI and GitLab pipelines, it becomes conceivable for example to automate the analysis of sites after every modification.
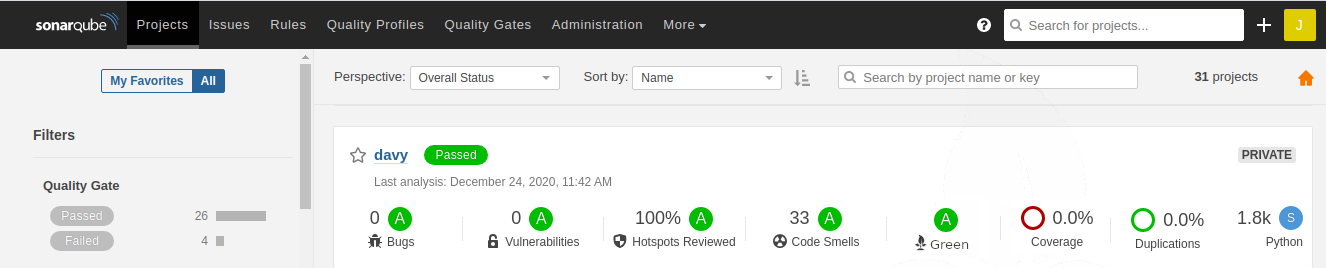
Finally, in the same way as the indicators for assessing code quality, information related to a platform’s ecological impact should eventually be integrated to other tools such as SonarQube, in order to have an overall view within a single interface.
A project that we are currently working on…