What is DevOps ?
The DevOps approach is characterised by the combination of software development (Dev) and IT infrastructure administration (Ops). Implementing it requires a strategic monitoring workflow. This monitoring helps ensure that cloud services retain high availability and performance in rapidly changing environments.
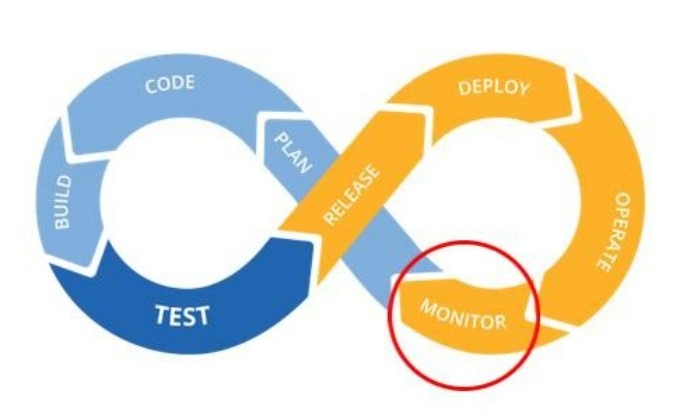
In this approach, supervision is an essential element for both the Dev and Ops teams. It allows you to trace the activities of an information system efficiently. Without supervision, you would not be able to react automatically and quickly to correct any anomalies in the application. In this article, we review the strategy and the tools we have put in place to meet these needs.
Once upon a time at Davidson…
Like many, at Dav’ we host the applications developed by Twister [Link] (our IT department) on two types of environments:
- Cloud (OpenShift)
- “on-premise”
Applications hosted on both types of environments run crons: OpenShift CronJobs at the application level hosted on the OpenShift cloud and system crons that run at the on-premise infrastructure level.
These crons allow us to schedule a task and run it regularly.
Technically, crons vary depending on the type of hosting:
- OpenShift uses OpenShift CronJobs. The CronJob task creates a template in the YML language that produces a Kubernetes job/pod.
- On the on-premise infrastructure VMs, Linux commands launch system crons. Each cron is made up of three elements: the script to run, the command that runs the script, and the script action or log.
Monitoring also varies depending on the type of environment:
- On OpenShift, CronJobs are monitored with the Prometheus monitoring solution configured at OpenShift.
- On VMs in the on-premise environment, some web applications are already monitored using the Grafana monitoring solution.
However, there is no unified way to simultaneously monitor the status of these crons. In other words, if the execution of a CronJob or a system cron fails, the Ops team will not be able to quickly have this centralised information for both types of crons.
To improve application monitoring, our project has two objectives:
- Monitor and display the state of health of both these types of crons in a centralised way,
- Display the last status of each cron on a single dashboard.
Choosing the tools
OpenShift
OpenShift is an open-source hybrid cloud platform from RedHat. It is designed for application development, deployment and management. It provides developers with an integrated environment to build and deploy Docker containers and manage them with the open-source Kubernetes orchestration platform.
With this combination, OpenShift allows any application to run anywhere Docker containers are supported.
Once developers submit their code to OpenShift, OpenShift orchestrates how and when applications are run. It also allows development teams to correct, refine, and evolve their applications.
OpenShift also provides an online catalogue. Some popular categories include container management, mobile app development, operating systems, programming languages, logging, surveillance, and database management.
With a very large community of contributors, OpenShift offers us many benefits:
- faster application development,
- multiple ways to manage and automate containers,
- automatic scaling to resources, traffic and set conditions,
- double the number of Pods to improve application performance,
- rollback capabilities,
- the advantages of containerisation over VMs (portability, reduced management, lighter and more efficient containers, etc.).
OpenShift monitoring
As for monitoring solutions, companies can choose between several useful DevOps tools to make the process easier, such as SolarWinds, Nagios, Zabbix, Prometheus, Graphite, and Centreon.
The following needs should be considered when selecting a monitoring solution:
- identifying problems and sending alerts to the administrator,
- recording and tracing information and history in real time,
- creating a personalised
To meet these needs, we have chosen the Prometheus & Grafana monitoring stacks. The advantages are:
- Prometheus and Grafana can be used as complementary services.
- When combined, they provide a robust time series database with excellent data visualisation capabilities.
- These two tools are widely used to monitor applications in container-based environments.
- As proof of this solution’s maturity, Prometheus and Grafana are OpenShift’s default monitoring stacks.
Prometheus
Prometheus is a tool created by SoundCloud. It is an open-source monitoring and alerting system that is considered as a real-time time series database with PromQL query language. Prometheus is widely used in modern DevOps workflows, especially for container and microservices-based frameworks.
The image below presents Prometheus’s architecture:
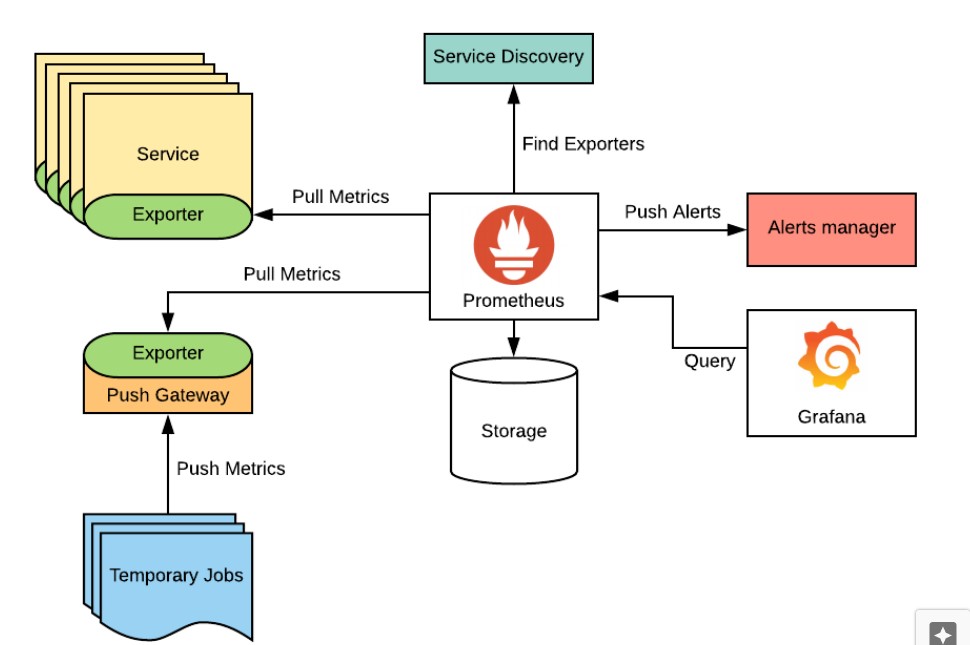
- Prometheus server: collects the metrics as time series data from the nodes and stores them in its database.
- Exporters: these components take Prometheus metrics and expose them via an endpoint in a specific format (in PromQL).
- Client libraries: Prometheus stores data in a time series format and only accepts data in this format. In use cases where there are no well-defined exporters to expose the metrics, you have to manually go through an “instrumentation” process in which you can define custom metrics that Prometheus is able to collect.
- The PushGateway: sometimes there are jobs whose lifespan is shorter than the Prometheus scraping interval (or metrics collection period). The Prometheus Push intervenes to allow these types of jobs to expose their metrics to Prometheus.
- The alert manager: this entity manages alerts sent by client applications. It routes alerts to communication channels such as email, Slack, and Discord.
- Web UI: this component is designed to display and export data from Prometheus by running PromQL queries. It leverages elements such as alert manager rules, configuration, and target machines.
- Service Discovery: to keep configurations to a minimum, Prometheus automatically discovers services that are running, for example on Kubernetes environments.
· Grafana
Grafana is an open-source solution that analyses data, extracts metrics from multiple applications, and monitors applications using a customisable Dashboard.
Grafana can connect to several data sources, called databases, such as Graphite, Prometheus, InfluxDB, ElasticSearch, MySQL, and PostgreSQL. Finally, the Grafana Dashboard supports multiple rows and panels so the user can also see the results of different data sources simultaneously.
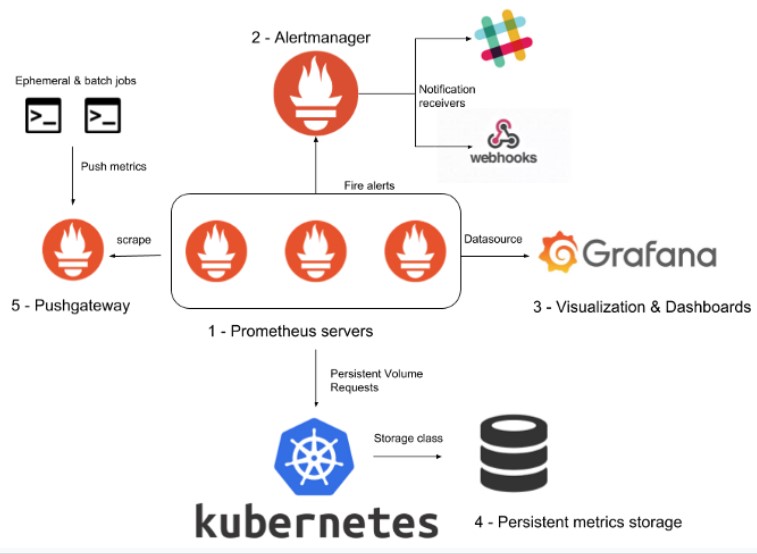
Why combine Prometheus and Grafana?
First, both of these tools are open source and widely adopted. They can be easily deployed for basic installations and are very efficient. They also have support for the “enterprise” version.
Secondly, Prometheus and Grafana have thriving contributor communities that help to anticipate a substantial number of use cases and solve a variety of problems.
Finally, in addition to being packaged with OpenShift by default, we already use them on our cluster to monitor other aspects. Furthermore, Prometheus is already configured to monitor the status of OpenShift CronJobs.
Application architecture
Foundation
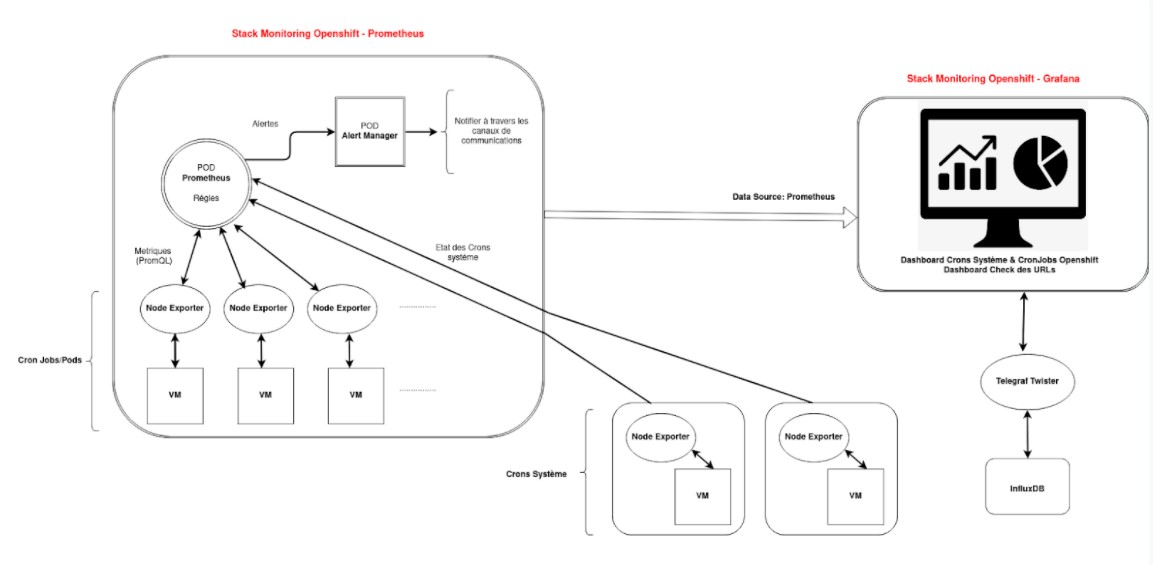
Prometheus and Grafana oversee OpenShift CronJobs and applications.
Monitoring OpenShift CronJobs
It operates as follows:
- CronJobs each create a job then a pod,
- in OpenShift, the Prometheus Pod is connected to these other Pods,
- these Pods send their metrics to Prometheus. Prometheus is thus informed of the state of the CronJobs.
To implement this setup, we proceeded as follows:
- configure an Exporter Node for each virtual machine in the OpenShift cluster,
- configure rules based on metrics,
- configure alerts at the Prometheus and Alert Manager levels.
Application monitoring
It operates as follows:
- The Grafana monitoring stack is configured with the Telegraf Twister data source.
- Telegraf sends information related to HTTP responses from various applications.
- This information is analysed using InfluxQ queries.
- A dashboard displays the following information for each application:
- The last HTTP response for each application.
- The response time in milliseconds for each application.
Target
We will add two elements to this foundation:
- An observer of the health status of system crons running on VMs outside the OpenShift cluster.
- A supervisor of the various applications’ non-response times with alert triggering.
System cron monitoring
To monitor the health status of these cron systems, which run on VMs outside the OpenShift cluster, we proceed as follows:
- Connect these VMs to the Prometheus Pod.
- On VMs, configure node exporters to send system cron status metrics to Prometheus.
- In Prometheus, use these metrics to set up trigger rules for alerts.
- In a Grafana Dashboard, display the latest status of each OpenShift CronJob and each system cron.
Application monitoring
To monitor the various applications’ non-response times and trigger alerts, we will use each application’s last HTTP response:
- a Grafana Dashboard will display each application’s non-response time,
- if one of the applications stops responding, Grafana will trigger an alert.
Fulfilment & results
OpenShift CronJobs & System cron monitoring
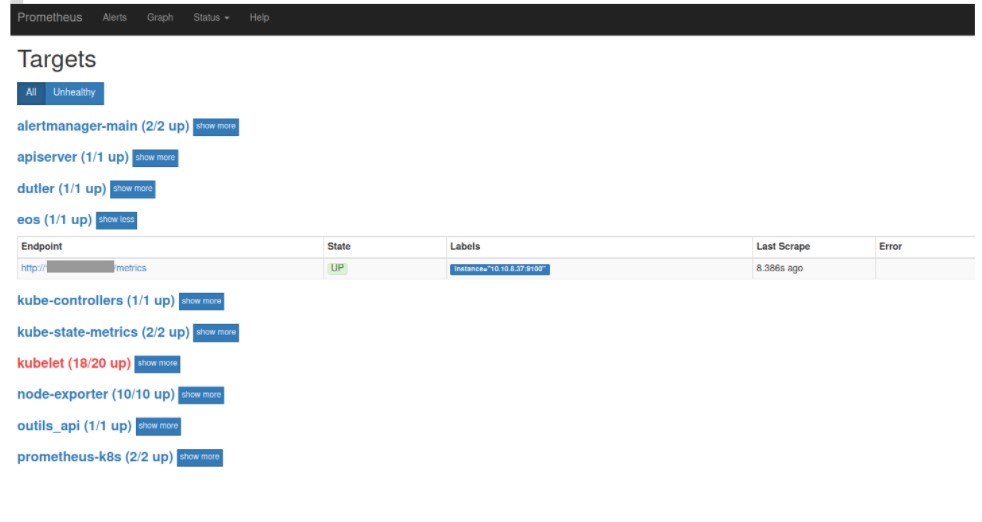
Linking VMs to the Prometheus Pod
We linked the Prometheus Pod to VMs that run system crons outside the OpenShift cluster.
Below is an example with “eos”. This is an internal application developed by the Twister team in PHP to manage the Davidson employee central database.
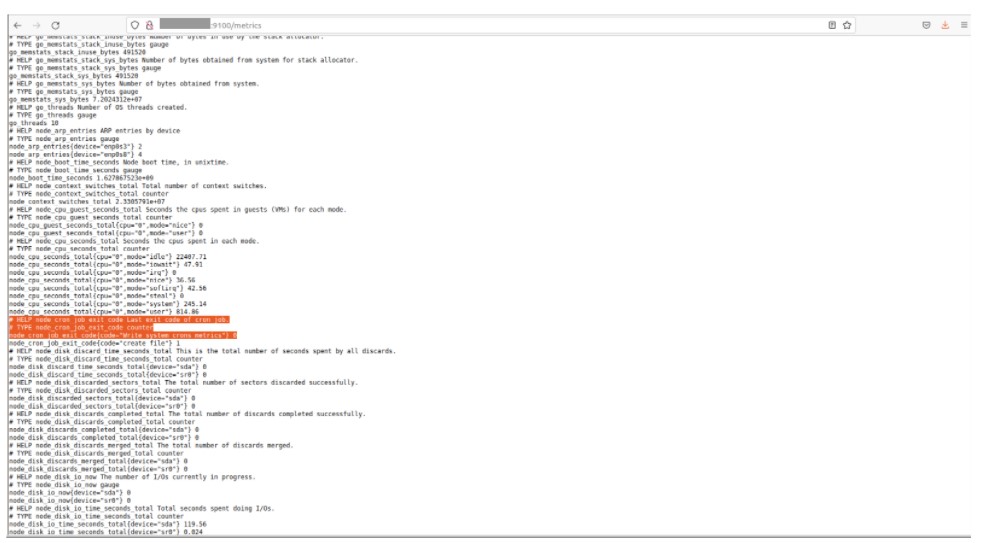
Reporting of metrics
Secondly, each VM added must be configured to send its system cron metrics.
This is the most important step because, by default, Prometheus does not have metrics to inform of system crons’ status. Usually, you have to configure an exporter but, for crons, no exporter is available.
We compensate for this absence in the following way:
- Configure an exporter node in each VM outside the OpenShift cluster.
- Add target devices to the basic Prometheus server configuration.
- Implement a Bash script that will customise and send metrics describing the status of system crons (0 for success, 1 for failure).
- Configure the “Node Textfile Collector” to parse all recorded metrics.
- Configure a rule that will be used to display alerts if a cron’s execution fails.
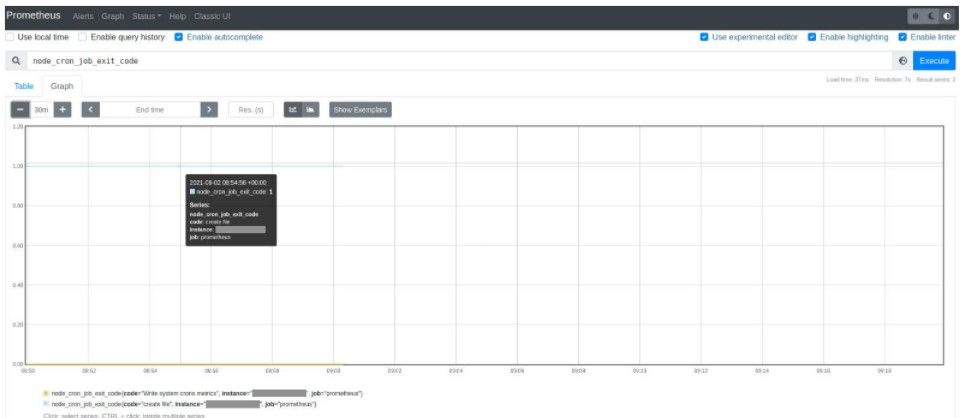
Prometheus can display a graph that shows the information returned by the metric.
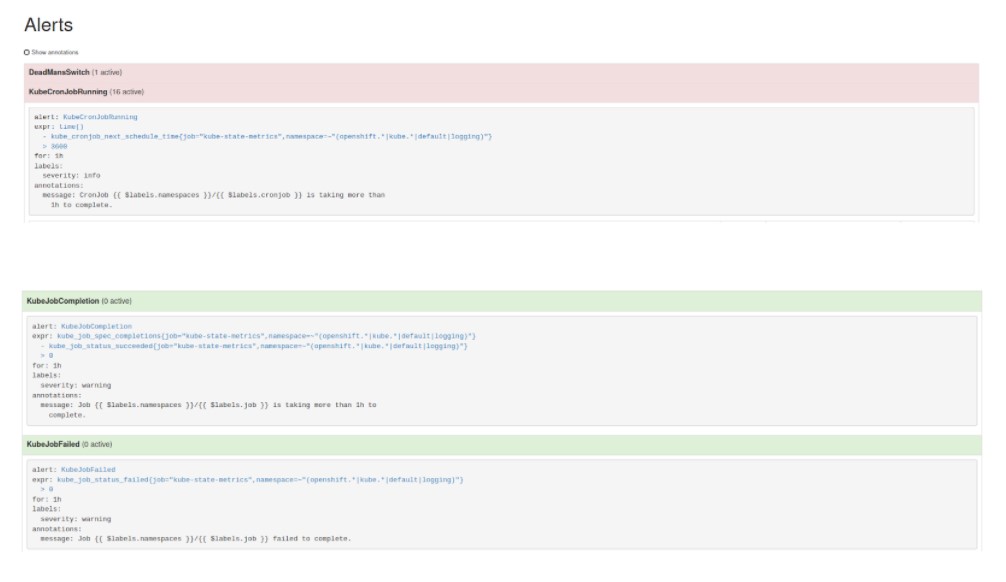
Alerts
Once a rule is configured, an alert is shown if a cron will not run correctly:
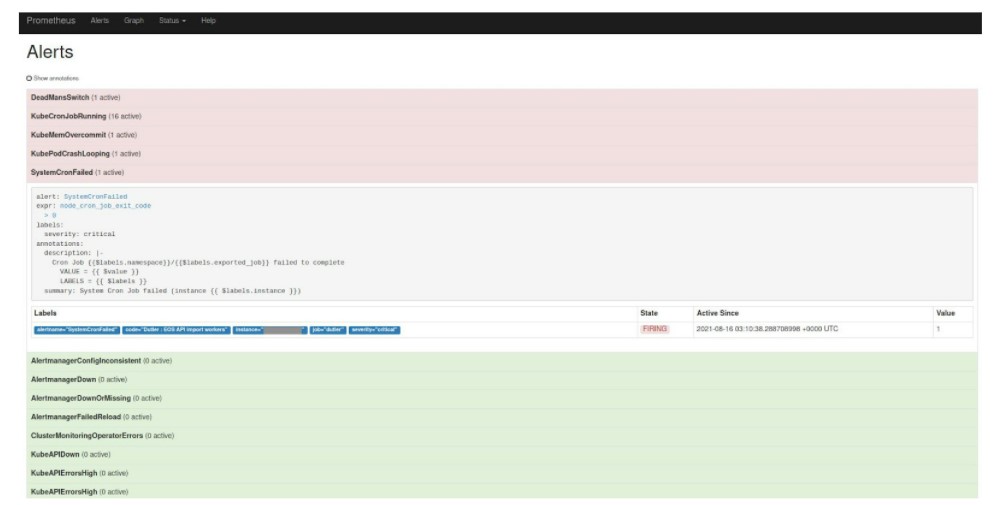
In addition to the ones in the starting point, there are also pre-configured rules/alerts to report the status of OpenShift CronJobs.
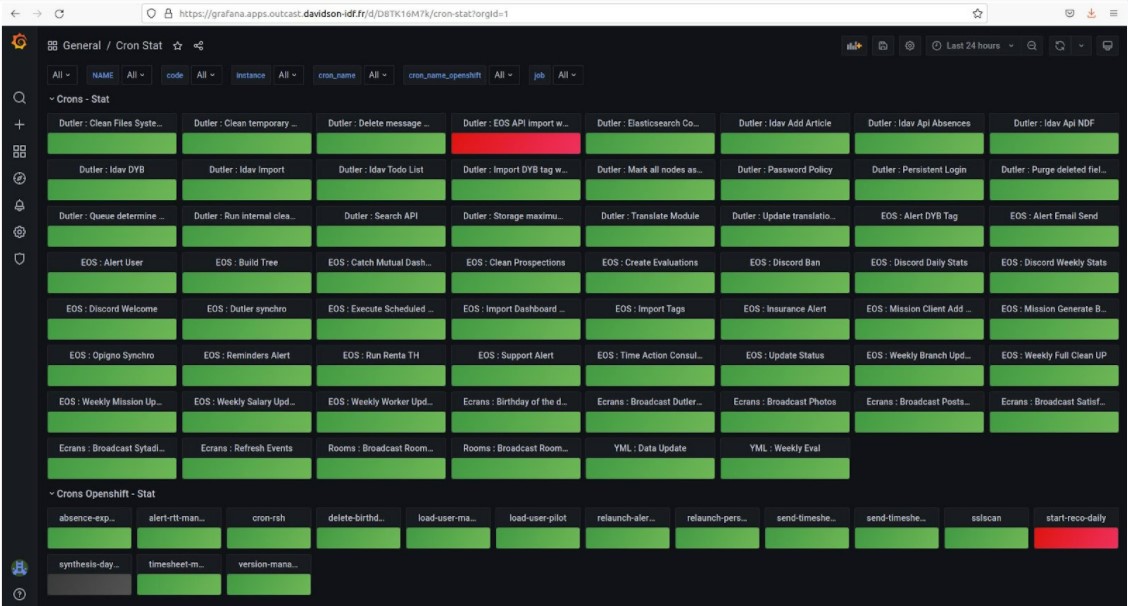
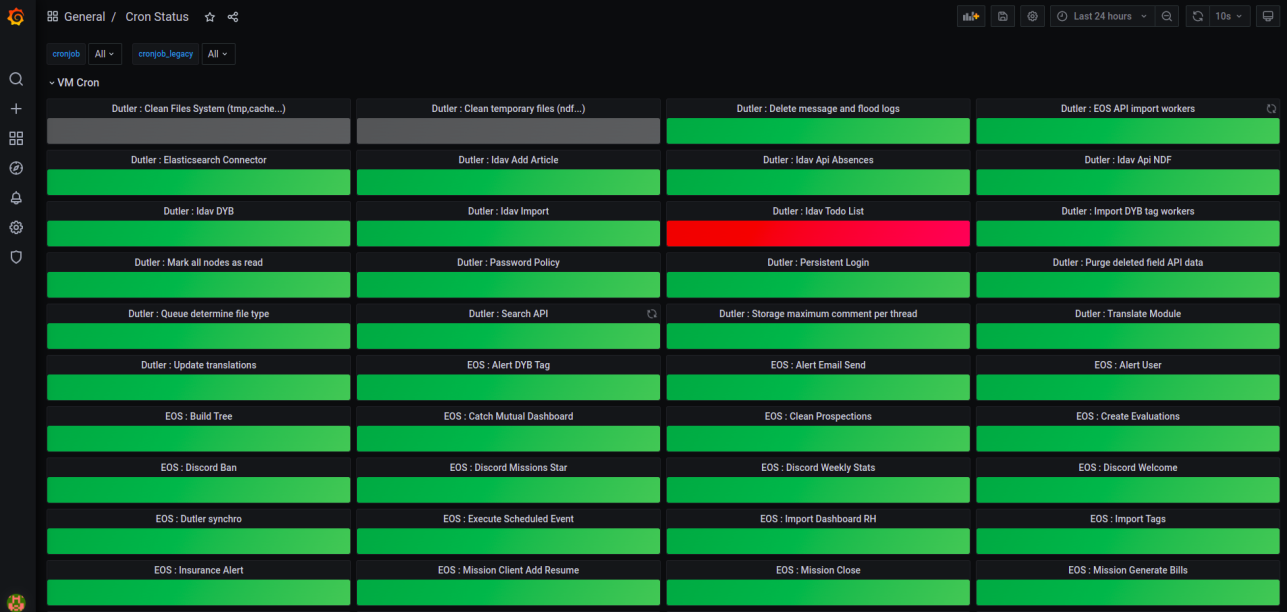
Dashboard
We can also view the status of all system crons as well as the OpenShift CronJobs on a Grafana Dashboard.
The Dashboard below is made up of two rows. Each corresponds to a category of cron, and each cron is shown as a panel.
- The “Crons – Stat” row shows all system crons.
- The “Crons OpenShift – Stat” row shows all OpenShift CronJobs.
- The crons that executed correctly are shown in green.
- In red, the failed crons.
Regarding alerts management, the rest of the process in the event of an incident, and the actions that must be taken to ensure proper processing, we considered certain points that were important to meeting our project’s needs, especially an effective monitoring system for the Ops team, which must respond quickly when a cron fails.
The dashboard will be displayed on a screen in front of the entire Dev & Ops team.
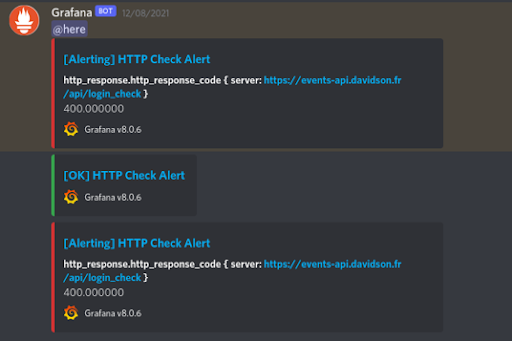
The Prometheus Alert Manager will send alerts for OpenShift CronJobs to the two communication channels: email and Discord.
Below is an example of an alert sent by the Prometheus alert manager via email.
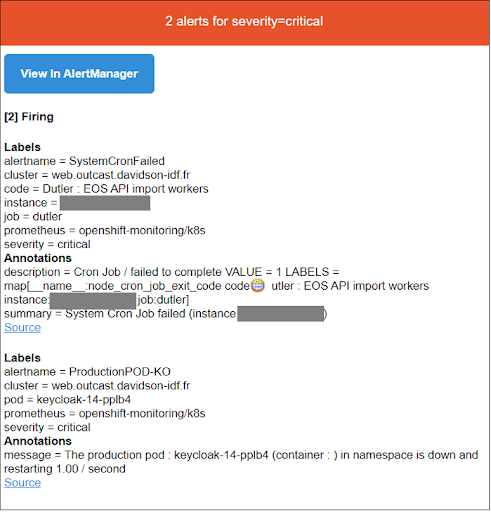
Similarly, to avoid disturbing the Dev team, the Ops team receives the alert in order to conduct an initial analysis of the reported anomaly, which it prioritises and then communicates to the Dev team.
Application monitoring
For applications, there is a Grafana “HTTP Response Monitoring Twister” dashboard that shows:
- the status of the last HTTP response from each application,
- The response time in milliseconds of each application over a given time interval.
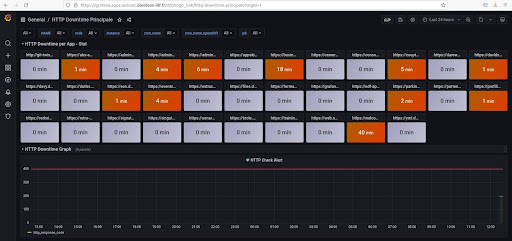
You must then create another “HTTP Downtime” dashboard.
- In the first Row, “HTTP Downtime per App – Stat”, each panel shows an application’s non-response time during a time interval to be selected at the top of the dashboard.
- The second row, “HTTP Downtime Graph”, shows the last 60 HTTP responses for each application.
In the same vein as this process and alerts management, these measures can apply to the Grafana alert manager, which has been configured to send alerts to the dedicated Discord channel should HTTP response time be equal to or greater than 400.
Conclusion
In this article, we discussed our approach to DevOps monitoring, which showed the different theoretical and practical aspects related to system crons, CronJobs, OpenShift, Prometheus, and Grafana, and how all these elements interact.
Results
We were able to implement.